To the average person, Microsoft Excel is a number-crunching program, used to store and track information, like household expenses. But it is extremely popular in business, as it’s highly visual and with the right training, relatively easy to use.
And, while many organisations think that Excel is only good for leaving you cross-eyed trying to comprehend an expanse of numbers or complicated financial reports, we promise you that it is capable of so much more than this, and is an incredibly powerful tool for a range of business processes in various occupations.
Here are just a few popular ways that Excel can be used in business:
- Data management
Excel is widely known as a brilliant tool for both data entry and storage, with the only limit on an Excel file’s size being the computing power and memory of the device it’s being stored on. And features like Microsoft Forms make it extremely easy for data input via customisable data entry forms, helping to build and maintain customer contact lists or employee work shift lists.
- Accounting and budgeting
Although Excel is defined as a ‘data management tool’, the most commonly managed data happens to be financial. The program is extensively used in finance and accounting functions, with many organisations running their entire budgeting and accounting functions entirely out of Excel spreadsheets. You’ll even find that there are a number of accounting and budgeting templates available to use.
- Financial analysis
On top of accounting and budgeting, extensive knowledge of Excel and its common functions is invaluable to those in the finance industry. Any data may be inputted and manipulated, as long as it’s quantifiable, allowing users to run technical calculations or produce fundamental accounting ratios for financial analysis.
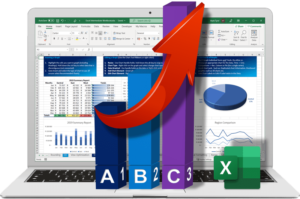
- Charting and graphing

From simple bar and pie charts to more complex scatter and area charts, Excel’s ability to transform rows and columns of digits into beautiful charts is unmatched. The program allows businesses to unlock the potential of their data, helping to add emphasis to business reports and persuasive marketing material.
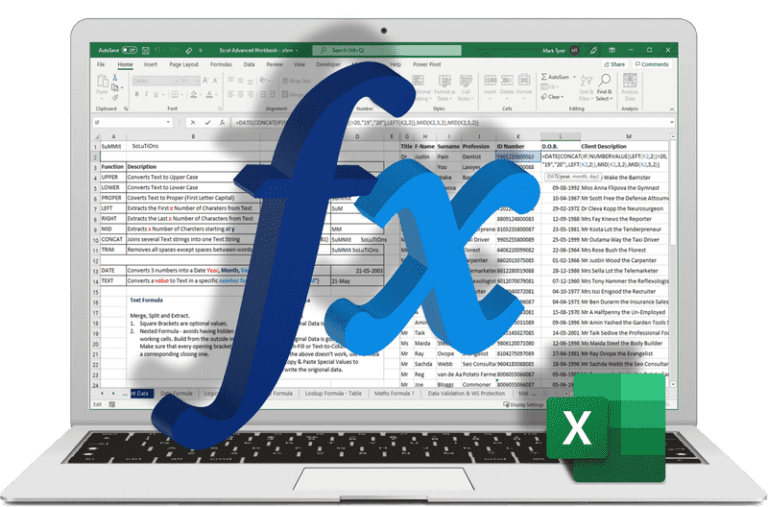
- Programming
In principle, you can write any computation in the Excel formula language. Excel’s LAMBDA function allows users to define custom functions, whether they’re quite simple or rather complex, by writing in the program’s own formula language.
- Customer relationship management (CRM)
A great way to boost your company sales is by making communication with your current and potential customers as efficient as possible. This can be achieved with a simple CRM sheet, with integrated sales, revenue tracking and emails in an all-in-one document.
- Inventory tracking
Inventory flows need to be tracked and managed so that business operations can continue running smoothly, and without overstocking on any items. This means keeping track of all supplier and client transactions, which may seem like a mammoth task, but fortunately Excel can help to keep you on top of your inventory before any major problems pop up.
- Goal planning

Achieving big goals isn’t easy, which is why many don’t accomplish most of theirs. But with the proper framework, anything is possible. Creating an Excel spreadsheet roadmap is great at holding yourself accountable and keeping from becoming overwhelmed. You’ll want to create columns like a ‘description’, ‘deadline’ and ‘stage’ or ‘phase’ column to track your progress.
- Project management
Excel provides the perfect platform for project plans through which a project’s progress can be tracked, in order to keep it on schedule. Project workbooks can be easily shared amongst employees. Here, Excel’s charting function may be used to create visual timelines. For example, a Gantt chart is an excellent choice, since it maps out tasks based on how long they’ll take, when they start and when they finish.
- Performance reporting
Effective performance management is essential to businesses to help align employees, stakeholders and systems to meet strategic objectives. Track your business’s performance using Excel by logging relevant business metrics or key performance indicators (KPIs) that display a measurable value and show the progress of your business objectives.
Microsoft Excel is one of the most important computer software programs used in the workplace today, and can optimise business efficiency by cutting down on time and effort. Just the other day we received feedback from one of our clients that the month end reporting solution, which we helped them implement using Excel, reduced the time spent from 4 days to 4 hours, and the 4 hours had coffee breaks in between!
If you feel that you could be using Microsoft Excel more effectively in your business, get in contact with us. We offer a range of training courses as well as corporate consulting services.